Feature tour

A closer look at how Laqua works in the field.

From individual meter telemetry to portfolio-wide dashboards, Laqua gives operators, property teams, and occupants a dedicated experience for monitoring consumption, resolving alerts, and validating network performance.

5 Core product views
24/7 Access to live usage data
LoRaWAN Native network diagnostics

Designed for every user in the water data workflow

Laqua combines operational tools for utilities and property teams with self-service portals for occupants. The result is a single platform that can support investigation, billing transparency, leak response, and long-term optimization without switching systems.

  • Unified meter record with latest reading, status, transmitter health, and provisioning details
  • Consumption charts by hour, day, and month to spot abnormal patterns quickly
  • Dedicated views for residents, customer support, property managers, and technical teams
  • Built-in LoRaWAN signal quality and message frequency diagnostics for every device
Laqua meter details screen showing summary, inventory, and integrated transmitter status
Meter operations

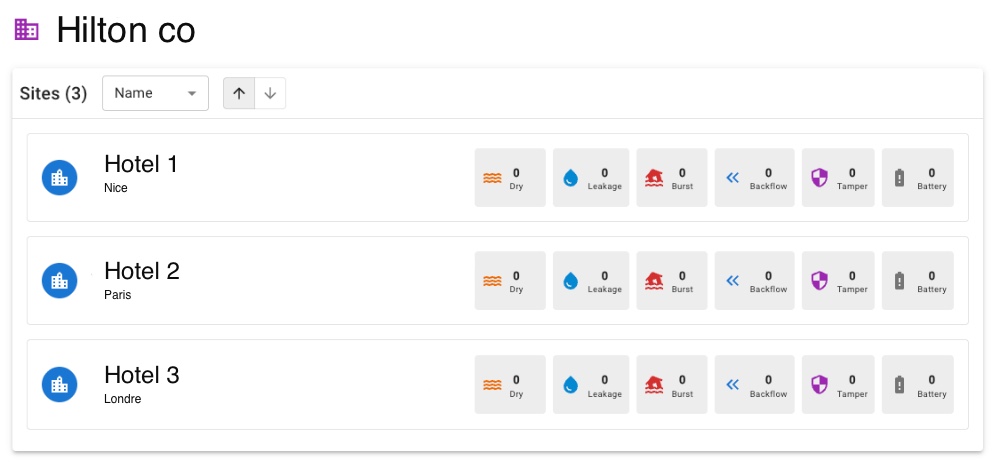
Meter details bring inventory, readings, and transmitter health together.

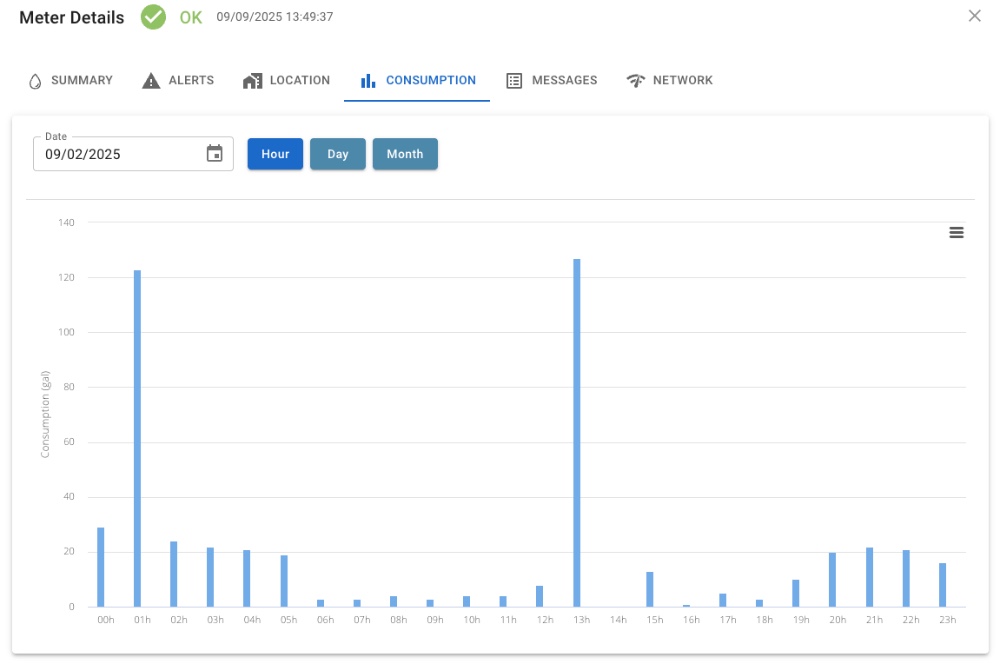
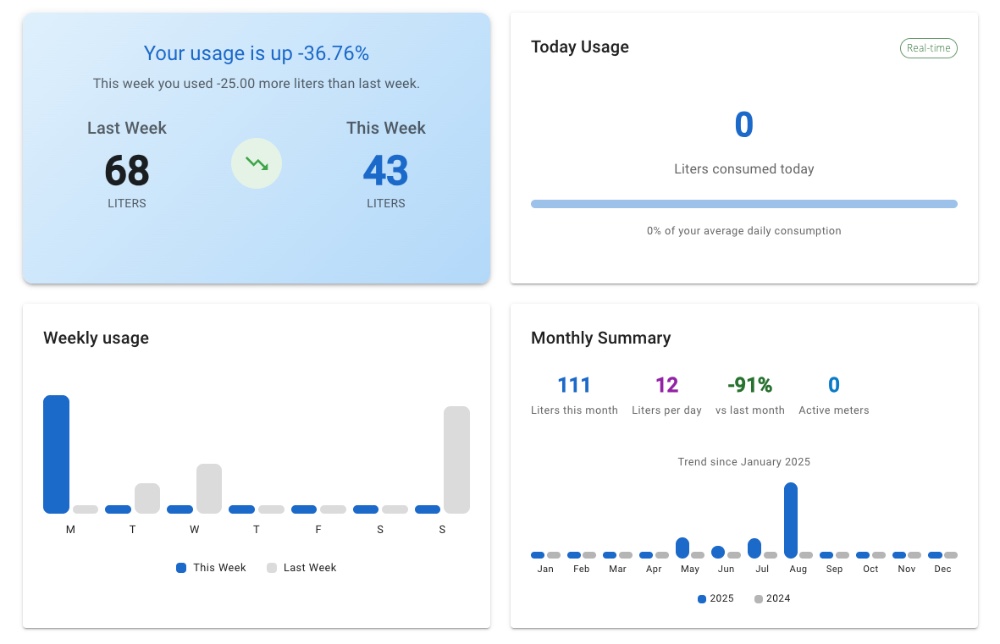
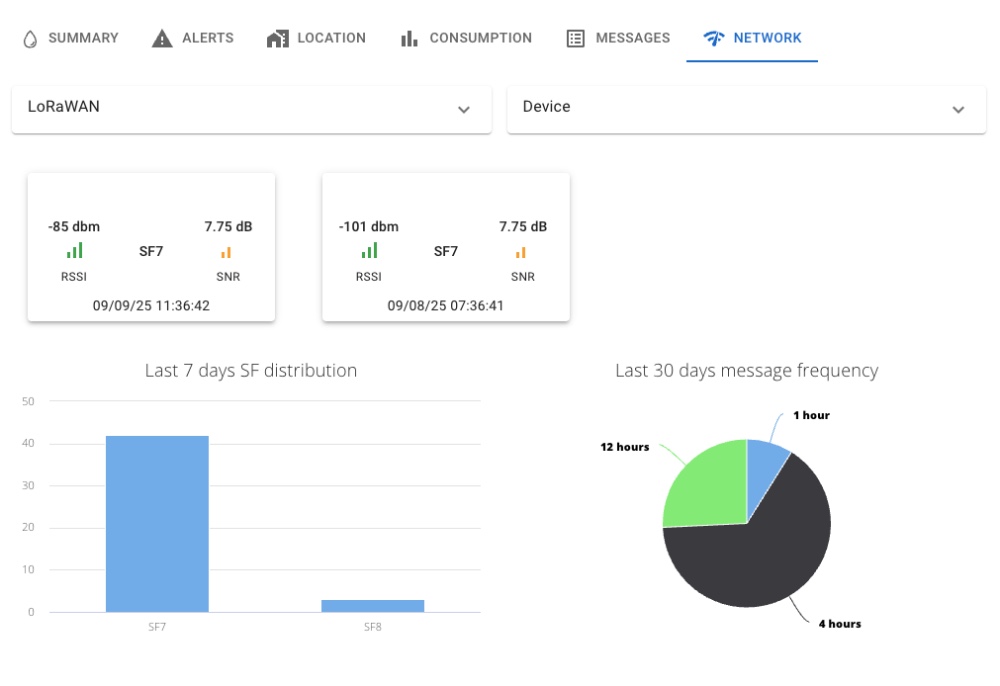
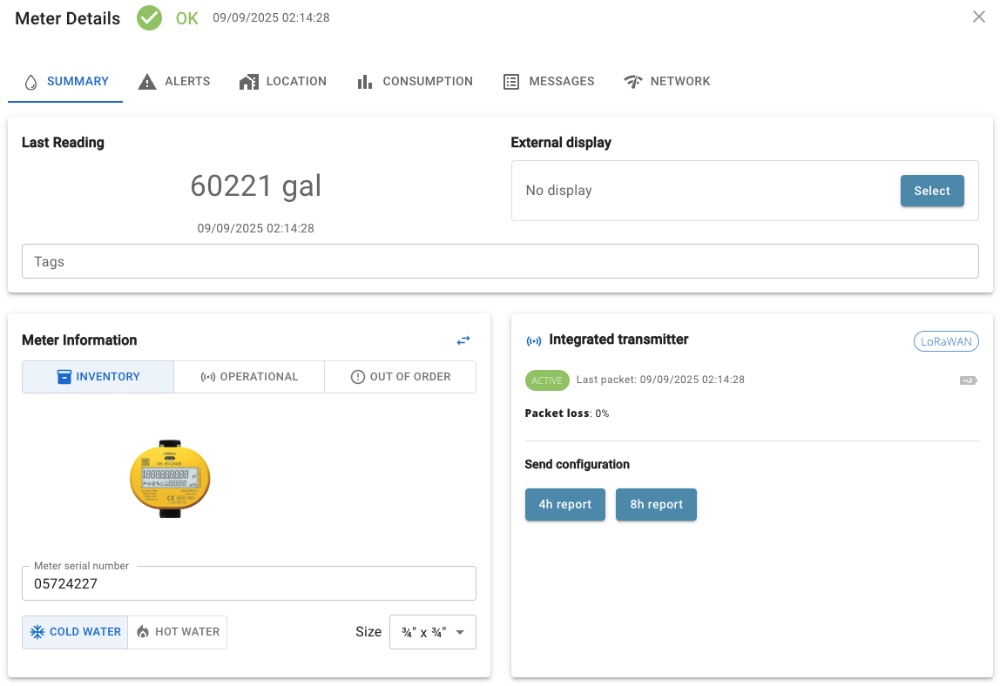
Each meter has a dedicated operational workspace with the latest reading, meter status, transmitter activity, packet-loss visibility, and send-configuration controls.

  • Review the last reading, timestamp, serial number, size, and meter type in one screen
  • Verify whether the transmitter is active and when the last packet was received
  • Support installer and maintenance workflows without opening separate back-office tools
Laqua consumption screen with hourly water usage chart
Consumption intelligence

Hourly usage charts make unusual consumption patterns obvious.

Operators can switch between hour, day, and month views to understand when water is used, compare periods, and flag spikes that suggest leakage, burst events, or waste.

  • Inspect hour-by-hour patterns for each meter using clean bar charts
  • Compare usage windows to isolate overnight flow, recurring spikes, or unexplained peaks
  • Give service teams evidence before dispatching a technician to site
Laqua customer portal with weekly usage and monthly summary widgets
Occupant experience

The customer portal helps residents understand and reduce water usage.

Occupants get a self-service view of weekly and monthly performance, day-level trends, and real-time consumption context so they can react faster to abnormal usage.

  • Show weekly and monthly summaries in language that non-technical users can understand
  • Help reduce billing disputes with transparent historical consumption comparisons
  • Create a better experience for residents while reducing support workload
Laqua manager portal listing multiple sites with alarm summary cards
Portfolio oversight

Property managers can scan every site from a single portfolio dashboard.

Site cards summarize alarm counts and property status so building teams can prioritize where to investigate first without opening each meter individually.

  • List sites with a clear operational summary for Dry, Leakage, Burst, Backflow, Tamper, and Battery events
  • Support multi-site hospitality and residential portfolios from one interface
  • Turn distributed meter fleets into a manageable daily workflow
Laqua network diagnostics screen with RSSI, SNR, and message frequency charts
Network diagnostics

LoRaWAN diagnostics confirm whether data quality issues come from the meter or the network.

Signal strength, SNR, spreading-factor distribution, and message frequency charts give technical teams the context they need to validate coverage and improve reliability.

  • Check RSSI and SNR values for recent packets without exporting data elsewhere
  • Analyze spreading-factor distribution and 30-day message frequency from the same device view
  • Accelerate root-cause analysis during deployment, commissioning, and support

One platform for operations, occupants, and network teams

Laqua is designed to keep the same data model flowing from the field meter to the customer portal. That means fewer silos, faster troubleshooting, and a more credible water management experience across every stakeholder.

Contact sales

Share your details and the Pilot Things sales team will get back to you shortly.